Wednesday, August 31, 2016

Mean Reversion: Gravitational Super Force or Dangerous Delusion?

In my last post on the danger of using  single market metrics to time markets, I made the case that though the Shiller CAPE was high, relative to history, it was not a sufficient condition to conclude that US equities were over valued. In the comments that followed, many disagreed. While some took issue with measurement questions, noting that I should have looked at ten-year correlations, not five and one-year numbers, others argued that this metric was never meant for market timing and that the real message was that the expected returns on stocks over the next decade are likely to be low. I was surprised at how few brought up what I think is the central question, which is the assumption that the CAPE or any other market metric will move back to historic norms. This unstated belief that things revert back to the way they used to be is both deeply set, and at the heart of much of value investing, especially of the contrarian stripe. Thus, when you buy low PE stocks and or sell a stock because it has a high PE, you are implicitly assuming that the PE ratios for both will converge on an industry or market average. I am just as prone to this practice as anyone else, when I do intrinsic valuation, when I assume that operating margins and costs of capital for companies tend to converge on industry norms. That said, I continue to worry about how many of my valuation mistakes occur because I don’t question my assumptions about mean reversion enough. So, you should view this post as an attempt to be honest with myself, though I will use CAPE data as an illustrative example of both the allure and the dangers of assuming mean reversion.

Mean Reversion: Basis and Push Back
The notion of mean reversion is widely held and deeply adhered to not just in many disciplines but in every day life. In sports, whether it be baseball, basketball, football or soccer, we use mean reversion to explain why hot (and cold) streaks end. In investments, it is an even stronger force explaining why funds and investors that fly high come back to earth and why strategies that deliver above-average returns are  unable to sustain that momentum.

In statistics, mean reversion is the term used to describe the phenomenon that if you get an extreme value (relative to the average) in a draw of a variable, the second draw from the same distribution is likely to be closer to the average. It was a British statistician, Francis Galton, who first made official note of this process when studying the height of children, noted that extreme characteristics on the part of parent (a really tall or short parent) were not passed on. Instead, he found that the heights reverted back to what he called a mediocre point, a value-laden word that he used to describe the average. In the process, he laid the foundations for linear regressions in statistics.

In markets and in investing, mean reversion has not only taken on a much bigger role but has arguably had a greater impact than in any other discipline. Thus, Jeremy Siegel's argument for why "stocks win in the long term" is based upon his observation that over a very long time period (more than 200 years), stocks have earned higher returns than other asset classes and that there is no 20-year time period in his history where stocks have not outperformed the competition. Before we embark on on examination of the big questions in mean reversion, let's start by laying out two different versions of mean reversion that co-exist in markets.
  • In time series mean reversion, you assume that the value of a variable reverts back to a historical average. This, in a sense, is what you are using when looking at the CAPE today at 27.27 (in August 2016) and argue that stocks are over priced because the average CAPE between 1871 and 2016 is closer to 16.
  • In cross sectional mean reversion, you assume that the value of a variable reverts back to a cross sectional average. This is the basis for concluding that an oil stock with a  PE ratio of 30 is over priced, because the average PE across oil stocks is closer to 15. 
At the risk of over generalization, much of market timing is built on time series mean reversion, whereas the bulk of stock selection is on the basis of cross sectional mean reversion. While both may draw their inspiration from the same intuition, they do make different underlying assumptions and may pose different dangers for investors.

The nature of markets, though, is that every point of view has a counter, and it should come as no surprise that just as there are a plethora of strategies built around mean reversion, there are almost as many built on the presumption that it will not happen, at least during a specified time horizon. Many momentum-based strategies, such as buying stocks with high relative strength (that have gone up the most over a recent time period) or have had the highest earnings growth in the last few years, are effectively strategies that are betting against mean reversion in the near term. While it is easy to be an absolutist on this issue, the irony is that not only can both sides be right, even though their beliefs seem fundamentally opposed, but worse, both sides can be and often are wrong.

Mean Reversion: The Questions
You can critique mean reversion at two levels. At the level at which it is usually done, it is more about measurement than about process, with arguments centered around both how to compute the mean and the timing and form of the reversion process. There is a fundamental and perhaps more significant critique of the very basis of mean reversion, which is based on structural changes in the process being analyzed.

The Measurement Critique
Let’s say that both you and I both believe in mean reversion. Will we respond to data in the same way and behave the same way? I don't think so and that is because there are layers of judgments that lie under the words “mean” and “reversion”, where we can disagree. 
  • On the mean, the numbers that you arrive at can be different, depending upon the time period you look at (if it time series mean reversion) or the cross sectional sample (if it is a cross sectional mean reversion), and you can get very different values with the arithmetic average as opposed to the median. With cross sectional data, for instance, the oil company analysis may be altered depending on whether your sample is of all oil companies, just larger integrated oil companies or smaller, emerging market oil companies. For time series variations, consider the historical time series of CAPE and how different the "mean" looks depending on the time period used and how it was computed.
  • On the reversion part, there can be differences in judgment as well. First, even if we both agree that there is mean reversion, we can disagree on how quickly it will happen. That has profound consequences for investing, because there may be a time horizon threshold at which we may not be to devise an investment strategy to take advantage of the reversion. Second, we can disagree over how the metric in question will adjust. To illustrate, assume that the mean reversion metric is CAPE and that we both agree that  the CAPE of 27 should drop to the historic norm of 16 over the next decade. This can be accomplished by a drop in stock prices (a market crash) or by a surge in earnings (if you can make an argument that earnings are depressed and are due for recovery). The implications for investing can be very different.
In summary, there is a lot more nuance to mean reversion than its strongest proponents let on. One reason that they try to make their case look stronger than it is may be because they are selling others on their investment thesis and hoping that if they can convince enough people to make it self fulfilling. The other, and perhaps more dangerous reason, is to convince themselves that they are right, as a precursor to action. 

The Fundamental Critique
The process of mean reversion is built on the presumption that the underlying distribution (whether it be a time series or cross sectional) is stationary and that while there may be big swings from year to year (or from company to company), the numbers revert back to a norm. That is the elephant in the room, the really big assumption, that drives all mean reversion and it is its weakest link. If there are structural changes that alter the underlying distribution, there is no quicker way to ruin that trusting in mean reversion. The types of structural changes that can cause distribution to go awry range the spectrum, and the following is a list, albeit not comprehensive, of why these changes in the context of mean reversion over time.
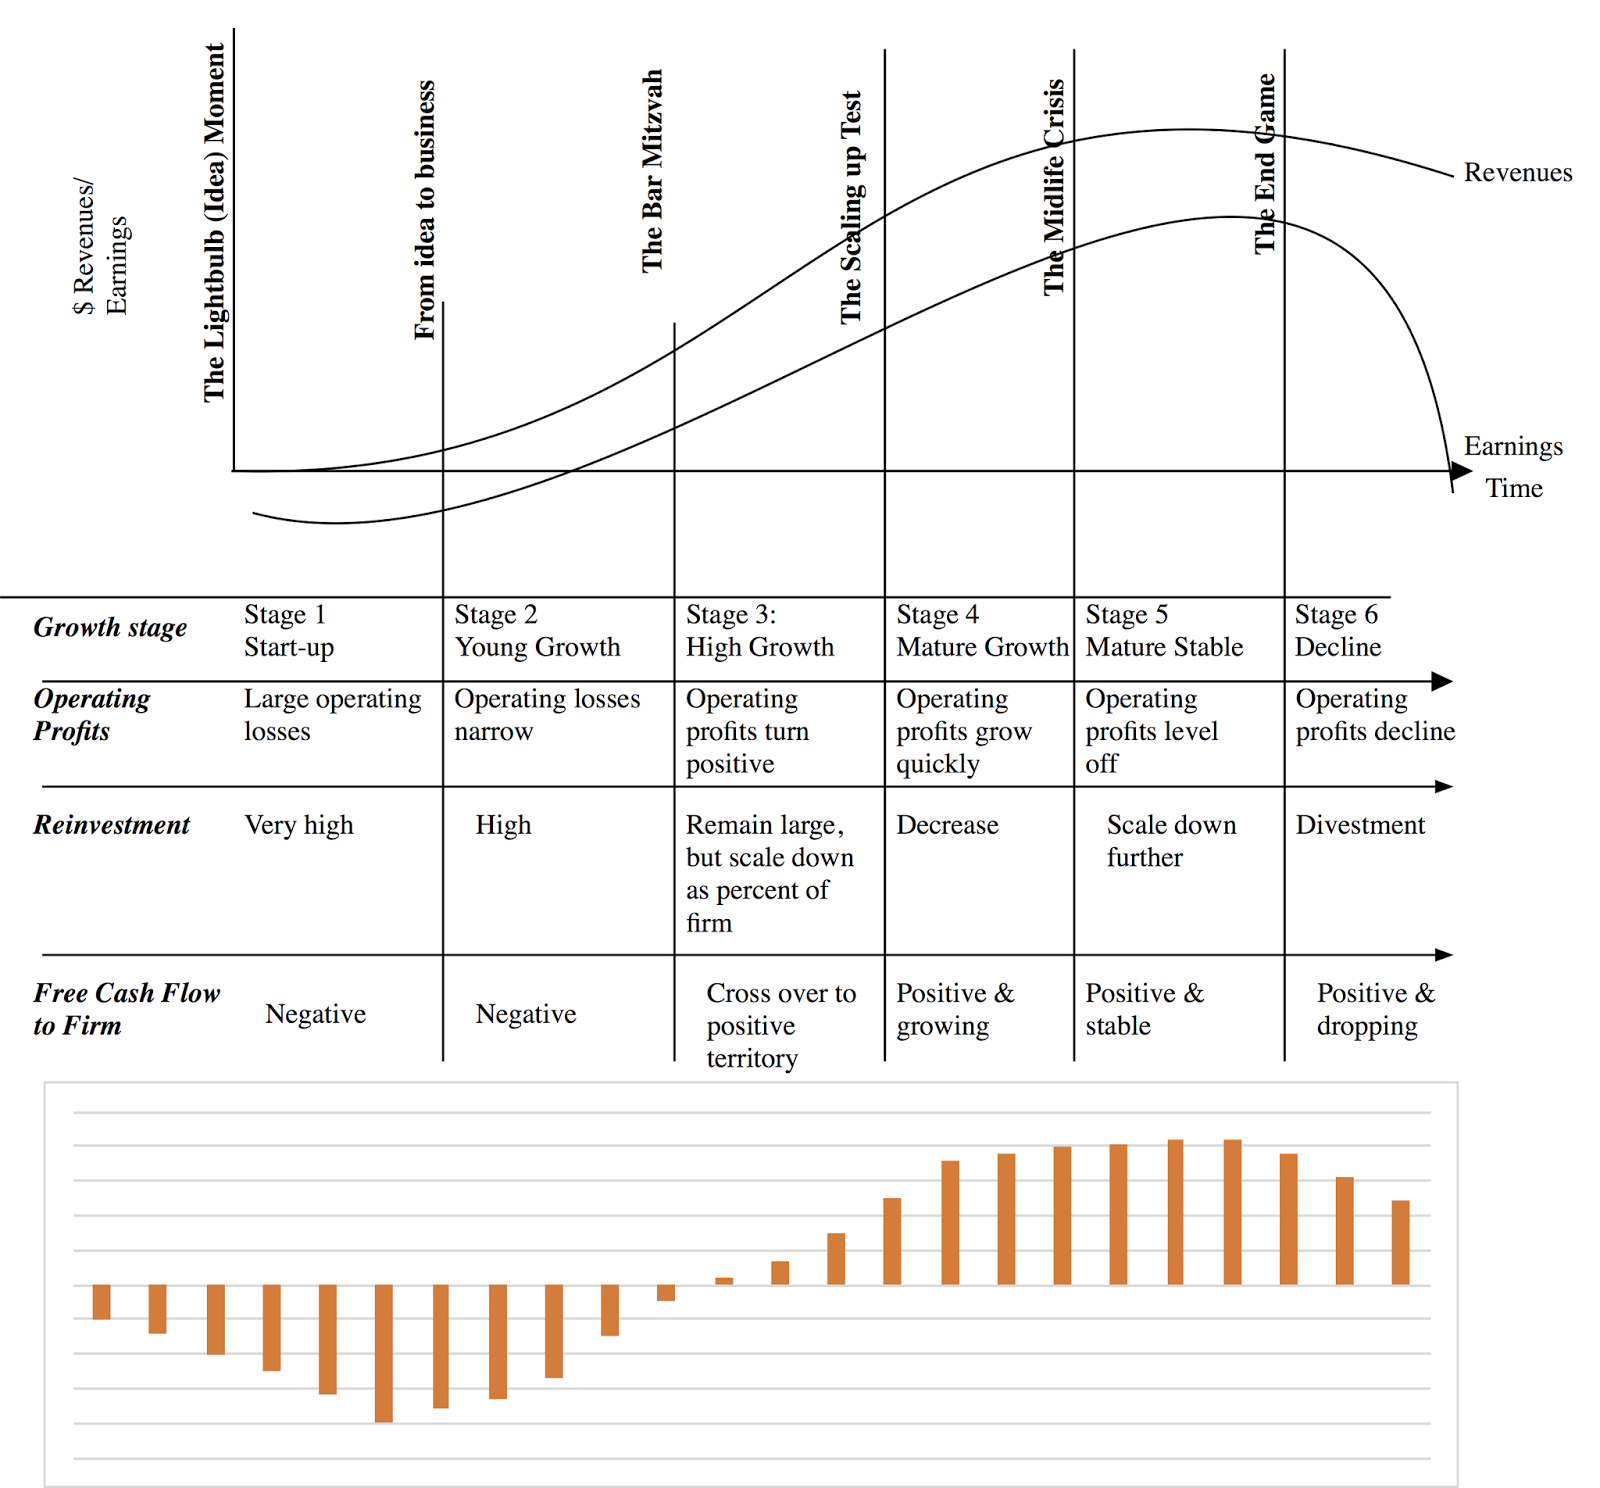
  • The first is aging, with the argument easiest to make with individual companies and more difficult with entire markets. As companies move through the life cycle, you will generally see the numbers for the company reflect that aging, rather moving to historic norms. That is especially true for growth rates, with growth rates decreasing as a company scales up and becomes more mature, but it is also true of both other operating numbers (margins, costs of capital) as well as pricing metrics (price earnings ratios and EV multiples). While markets, composed of portfolios of companies, are less susceptible to aging, you could argue that aging equity markets (the US, Japan and Europe) will exhibit different characteristics than they did when were younger and more vibrant. 
  • The second is technology and industry structure, shaking up both the product market structure and creating challenges for accountants. This is true clearly at the company level, as is the case with retailing, where Amazon's entry and subsequent growth has laid waste to historic norms for this sector, bringing down operating margins and changing reinvestment patterns. It is also true at the market level, where an increasing proportion of the equity market (say, the S&P 500) are service and technology stocks and the accounting for expenses in these sectors (with many capital expenses being treated as operating expenses) creating questions about whether the E in the PE for the S&P 500 is even comparable over time.
  • The third is changes in consumer and investor preferences, with the first affecting the numbers in product markets and the latter in financial markets. For instance, there is an argument to be made that the surge in index funds has altered how stocks are priced today, as opposed to two or three decades ago.
In the context of CAPE, again, and using Shiller's entire database, which goes back to 1871, let's take a quick look at how much both the US economy has grown and changed since 1871 and how those changes have affected the composition of US stocks.

In 1871, coming out of the civil war, the US was more emerging than developed market, with the growth and risk that goes with that characterization. In 1900, the US equity market had become the largest in the world, but 63% of its value came from railroad stocks, reflecting both their importance to the US economy then and their need for equity capital. For most of the next few decades, the US continued on its path as a growth market and economy, though the growth trend was brought to a stop by the great depression.  The Second World War firmly established the US as the center of the global economy and the period between 1945 and 2000 represents the golden age of mean reversion, a period where at least in the US, mean reversion worked like a charm not just across stocks but across time. It is worth noting that many of the now-accepted standard practices in both corporate finance and valuation, from using historical risk premiums for stocks to attaching premiums for expected returns to small-cap stocks to believing that value stocks beat growth stocks (with low PBV or low PE as a proxy for value) came from researchers poring over this abnormally mean-reverting financial history. I trace my awakening to the dangers of mean reversion to the 2008 crisis but I believe that the signs of structural change were around me for at least a decade prior. After all, the shift from a US-centric global economy to one that was more broadly based started occurring in the 1970s and continued, with fits and bounds, in the decades after. Similarly, the US dollar's reign as the global currency was challenged by the introduction of the Euro in 1999 and put under further strain by the growth in emerging market currencies.

So, how did 2008 change my thinking about markets, investing and valuation? First, globalization is here to stay and while it has brought pluses, it has already brought some minuses. As I noted in my post on country risk, no investor or company can afford to stay localized any more, since not only do market crisis in one country quickly become global epidemics, but a company that depends on just its domestic market for operations (revenues and production) is now more the exception than the rule. Second, the fact that financial service firms were at the center of the crisis, has had long term consequences. Not only has it led to a loss of faith in banks as well-regulated entities, run by sensible (and risk averse) people, but it has increased the role of central bankers in economies, with perverse consequences. In their zeal to be saviors of the economy, central bankers (in my view) have contributed to an environment of low economic growth and higher risk premiums. Third, the low economic growth and low inflation has resulted in interest rates lower than they have been historically in most currencies and negative interest rates in some. I know that there are many who believe that I am over reacting and that it only a question of time before we revert back to more normal interest rates, higher economic growth and typical inflation but I am not convinced. 

From Statistical Significance to Investment Return Payoff
The standard approach to showing mean reversion is start with historical data and establish mean reversion with statistics. I will start with that basis, again using CAPE as my illustrative example, but will then build on it to show why, even if you believe in mean reversion and you base it on sound statistics, it is so difficult to convert statistical significance into market-beating returns.

The statistics
If you were looking at a data series, how would you go about showing mean reversion? There are three simple statistical devices that you can draw. The first is graphical, a scatter plot of the data that shows the mean reversion over time. In the context of CAPE, for instance, this is the graph that you saw in my last post:
Historical data on Shiller CAPE
The problem with this plot is that it is weak evidence for investing, since you don't make money from buying or selling PE but from buying and selling stocks. In fact, even in this plot, you can see that the CAPE case that stocks are over priced is weakened because I have used a 25-year median for comparison. A stronger graphical backing for mean reversion would then graph stock returns in subsequent time periods as  a function of the CAPE today, with a higher CAPE (relative to history) translating into lower returns in a future period. 

Looking at this data, at least, the evidence seems strong that a high CAPE today goes with lower stock returns in future periods, with the mean reversion becoming stronger for longer time periods.

The relationship between the market timing metric and returns can be quantified in one of two ways. You could compute the correlation between the metric and returns, with a more negative correlation indicating stronger mean reversion. Updating my CAPE/ returns correlation metric, with 10-year returns added to the mix, you can see again the basis for the market timing argument:

You an build on these correlations and run regressions (linear or otherwise) where you regress returns in future periods against the value of the metric today. The results of those regressions, with CAPE as the market metric, are summarized below:
What does this mean? If you buy into mean reversion and can live with the noise or error in your estimate (captured in the R-squared), these regressions back up the correlation findings, insofar as your CAPE-based predictions get more precise for longer time period returns. In fact, if you are one of those who lives and dies by statistics, using today's CAPE of 27.27 in this regression will yield a predicted annualized return of 4.30% on stocks for the next 10 years:
Expected annualized return in next 10 years = 16.24% - 0.0044 (27.27) = 4.30%
Scary, right? But before you over react, first recognize that this prediction comes with a standard error and range and second, please read on.

The Investment Action
If you have sat through a statistics class, you have probably heard the oft-repeated caution that "correlation is not causation", a good warning if you are a researcher trying to explain a phenomenon but not particularly relevant, if you are an investor. After all, if you can consistently make a lot of money from a strategy, do you really need to know why? The biggest challenge in investing is whether you can convert statistical significance ( a high correlation or a regression with impressive predictive power) into investment strategy. It is at this level that market timing metrics run into trouble, and using CAPE again, here are the two ways in which you can use the results from the data to change the way you invest.

If you are willing to buy into the notion that the structural changes in the economy and markets have not changed the historical mean reversion tendencies in the CAPE, the most benign and defensible use of the data is to reset expectations. In other words, if you are an investor in stocks today, you should expect to make lower returns for the next 10 years than you have historically. This has consequences for how much investors should save for future retirement or how much states should set aside to cover future contractual obligations, with both set asides increasing because your expected returns are lower. 

It is when you decide to use the CAPE findings to do market timing that the tests become more arduous and difficult to meet. To understand what this means, let's go back to the basic asset allocation decision that all investment begins with. Given your risk aversion (a function of both your psychological make-up and the environment you are in) and liquidity needs (a function of your age, wealth and dependents), there is a certain mix of stocks, bonds and cash that is right for you. With market timing, you will alter this mix to reflect your views on desirable (or under priced) markets and undesirable ones. Thus, your natural mix is 60% stocks, 30% bonds and 10% cash, and you believe (using whatever market timing metric you choose) that stocks are over priced, you would lower your allocation to stocks and increase your allocation to either bonds or cash. You could further refine this market timing algorithm for domestic stocks versus foreign stocks or bring in other asset classes such as collectibles and real estate. The test of a market timing strategy therefore requires more structure than the statistical analysis of checking for correlation or regression:
  1. Timing threshold: If you decide that you will time markets using a metric, you have to follow through with specifics. For instance, with CAPE as your market metric, and a high (low) CAPE being used as an indicator of an over valued (under valued) market, you have to indicate the trigger  that will initiate action. In other words, does the CAPE have to be 10% higher, 25% higher or 50% higher than the historic average for you to start moving money out of stocks?
  2. Asset class alternatives: If you decide to move money out of stocks, you have to also specify where the money will go and you have four choices. 
  3. Holding period: You will have to specify how long you plan to stay with the "market timed" allocation mix, with the answers ranging from a pre-specified time horizon (1 year, 2 years or 5 years) to until the market timing metric returns to safe territory. 
  4. Allocation Constraints (if any): The allocation that you have for an asset class can be floored at zero, if you are a long only investor, but can be negative, if you are willing to go short. The cap on what you can allocate to an asset class is 100%, if you cannot or choose not to borrow money, but can be greater than 100%, if you can. 
Put simply, the lower your threshold, the more alternatives you have to investing in stocks, the shorter your holding period and the fewer your constraints, the more active you are as a market timer. It is in this context that I tried out different market timing strategies built around CAPE. The table below lists out the returns from a buy and hold strategy with a fixed mix of stocks, bonds and bills (60%, 30% and 10%) and contrasts it with returns over the same period from using a CAPE timing strategy of reducing the equity allocation to 40% if the CAPE is 25% higher than a 50-year median value and increasing the equity allocation to 80% if the CAPE is 25% lower than a 50-year median value. I report the numbers for the entire time period 1917-2016 and break it down into two fifty-year time periods (1917-1966, 1967-2016):
Download market timing spreadsheet
With this mix of timing choices (50-year median, 25% threshold and the given changes to equity allocation), the Shiller CAPE outperforms the buy and hold strategy for the 1917-2016 time period  but  under performs in the last fifty year time period. I know that your timing choices can be very different from mine and I have created options in this spreadsheet to let you change the choices to reflect your preferences to see if you can deliver better market timing results using CAPE. I did try a few variants and here is what I found.
  1. Time Period: With every variation of timing that I tried, the CAPE delivers a positive market timing payoff in the first half of the entire time period (from 1917 to 1966) and a negative one in the second half (1967-2016). In fact, I could not find a combination of timing devices that delivered positive payoff in the second time period.
  2. Choice of median: Using the lifetime median delivers better results during the "good" period (1917-1966) but worse results during the "bad" period (1967-2016). Using a shorter time periods for the median reduces the outperformance in the first half of the analysis period but improves it in the second half.
  3. Buy and Sell: The CAPE's timing payoff is greater when it is used as a buying metric than as a selling metric. In fact, you make a positive payoff from using a low CAPE as a buying indicator over the entire period but using it is a signal of over priced markets costs you money in both time period. 
  4. Market Timing magnitude: Increasing the degree to which you tilt towards or away from stocks, in reaction to the CAPE, just magnifies the return difference, positive or negative. Thus, in the first half of the century (1917-1966), changing your equity exposure more increases the payoff to market timing. In the second half, it makes the negative payoff worse.
In many ways, this testing is tilted in favor of finding that the Shiller CAPE works. First, while I have been careful not to use ex-post data, I have acted as if I know what the earnings for the year will be, at the end of each year, when my market timing decision is made. In reality, on December 31, 2012, I would know only the earnings for the first three quarters of 2012 and not quite the full year. Second, I am ignoring the transactions costs and taxes due from shifting large amounts in and out of stocks in my timing years. Those will represent a significant drain on my returns as an investor. Finally, I am assuming that there have been no structural shifts large enough to cause the mean reversion to break down. In spite of all of this, I am hard pressed to explain why we are so swayed by arguments based on this metric.

Conclusion
These are dangerous times for those who believe in mean reversion, for two reasons. The first is that our access to historical data is getting broader and deeper, with mixed consequences. Having more data allows us to find out more about the underlying fundamentals but since that data goes back so far, much of what we find no longer has relevance. The second is that doing statistical analysis no longer requires either homework or effort, with tools at our fingertips and statistical results are only a click away. Both in academia and in practice, I see more and more use of statistical significance as proof that you can beat markets and my reason devising and testing out market timing strategies with CAPE were not meant to be an assault on CAPE but more a cautionary note that statistical correlation is not cash in the bank. This may also explain why there are so many ways to beat the market, on paper, and so few seem to be able to deliver those magical excess returns, in practice. 

YouTube Video

Datasets
  1. CAPE: 1881-2016 (Shiller Data)
  2. Stock, Bond and Bill Returns (1881-2016)
  3. Market Timing Spreadsheet

Wednesday, August 24, 2016

Superman and Stocks: It's not the Cape (CAPE), it's the Kryptonite(Cash flow)!

Just about a week ago, I was on a 13-hour plane trip from Tokyo to New York. I know that this will sound strange but I like long flights for two reasons. The first is that they give me extended stretches of time when I can work without interruption, no knocks on the door or email or phone calls. I readied my lecture notes for next semester and reviewed and edited a manuscript for one of my books in the first half on the trip. The second is that I can go on movie binges with my remaining time, watching movies that I would have neither the time nor the patience to watch otherwise. On this trip, however, I made the bad decision of watching Batman versus Superman, Dawn of Justice, a movie so bad that the only way that I was able to get through it was by letting my mind wander, a practice that I indulge in frequently and without apologies or guilt. I pondered whether Superman needed his suit or more importantly, his cape, to fly. After all, his powers come from his origins (that he was born in Krypton) and not from his outfit and the cape seems to be more of an aerodynamic drag than an augmentation. These deep thoughts about Superman's cape then led me to thinking about CAPE, the variant on PE ratios that Robert Shiller developed, and how many articles I have read over the last decade that have used this measure as the basis for warning me that stocks are headed for a fall. Finally, I started thinking about Kryptonite, the substance that renders Superman helpless, and what would be analogous to it in the stock market. I did tell you that I have a wandering mind and so, if you don't like Superman or stocks, consider yourself forewarned!

The Stock Market’s CAPE
As stocks hit one high after another, the stock market looks like Superman, soaring to new highs and possessed of super powers.

There are many who warn us that stocks are overheating and that a fall is imminent. Some of this worrying is natural, given the market's rise over the last few years, but there are a few who seem to have surrendered entirely to the notion that stocks are in a bubble and that there is no rational explanation for why investors would invest in them. In a post from a couple of years ago, I titled these people as  bubblers and classified them into doomsday, knee jerk, conspiratorial, righteous and rational bubblers. The last group (rational bubblers) are generally sensible people, who having fallen in love with a market metric, are unable to distance themselves from it.

One of the primary weapons that rational bubblers use to back up their case is the Cyclically Adjusted Price Earnings (CAPE), a measure developed and popularized by Robert Shiller, Nobel prize winner whose soothsaying credentials were amplified by his calls on the dot com and housing bubbles. For those who don’t quite grasp what the CAPE is, it is the conventional PE ratio for stocks, with two adjustments to the earnings. First, instead of using the most recent year’s earnings, it is computed as the average earnings over the prior ten years. Second, to allow for the effects of inflation, the earnings in prior years is adjusted for inflation.  The CAPE case against stocks is a simple one to make and it is best seen by graphing Shiller’s version of it over time.
Shiller CAPE data (from his site)
The current CAPE of 27.27 is well above the historic average of 16.06 and if you buy into the notion of mean reversion, the case makes itself, right? Not quite! As you can see, even within the CAPE story, there are holes, largely depending upon what time period you use for your averaging. Relative to the fully history, the CAPE looks high today, but relative to the last 20 years, the story is much weaker. Contrary to popular view, mean reversion is very much in the eyes of the beholder.

The CAPE’s Weakest Links
Robert Shiller has been a force in finance, forcing us to look at the consequences of investor behavior and chronicling the consequences of “irrational exuberance”. His work with Karl Case in developing a real estate index that is now widely followed has introduced discipline and accountability into real estate investing and his historical data series on stocks, which he so generously shares with us, is invaluable. You can almost see the “but” coming and I will not disappoint you. Of all of his creations, I find CAPE to be not only the least compelling but also potentially the most dangerous, in terms of how often it can lead investors astray. So, at the risk of angering those of you who are CAPE followers, here is my case against putting too much faith in this measure, with much of it representing updates of my post from two years ago.
1. The CAPE is not that informative
The notion that CAPE is a significant improvement on conventional PE is based on the two adjustments that it makes, first by replacing earnings in the most recent period with average earnings over ten years and the second by adjusting past earnings for inflation to make them comparable to current earnings. Both adjustments make intuitive sense but at least in the context of the overall market, I am not sure that either adjustment makes much of a difference. In the graph below, I show the trailing PE, normalized PE (using the average earnings over the last ten years) and CAPE for the S&P 500 from 1969 to 2016 (last twelve months). I also show Shiller's CAPE, which is based on a broader group of US stocks in the same graph.
Download spreadsheet with PE ratios
First, it is true that especially after boom periods (where earnings peak) or economic crises (where trailing earnings collapse), the CAPEs (both mine and Shiller's) yield different numbers than PE.  Second, and more important, the four measures move together most of the time, with the correlation matrix shown in the figure. Note that the correlation is close to one between the normalized PE and the CAPE, suggesting that the inflation adjustment does little or nothing in markets like the US and even the normalization makes only a marginal difference with a correlation of 0.86 between the unadjusted PE and the Shiller PE.

2. The CAPE is not that predictive
The question then becomes whether using the CAPE as a valuation metric yields judgments about stocks that are superior to those based upon just PE or normalized PE. To test this proposition, I looked at the correlation between the values of different metrics, including trailing PE, CAPE, the inverse of the dividend yield, earnings yield and the ratio of Shiller PE to the Bond PE) today and stock returns in the following year and the following five years:
There is both good news and bad news for those who use the Shiller CAPE as their stock valuation metric. The good news is that the fundamental proposition that stocks are more likely to go down in future periods, if the Shiller CAPE is high today, seems to be backed up. The bad news is two fold. First, the relationship is noisy or in investment parlance, the predictive power is low, especially with one-year returns. Second, the trailing PE actually does a better job of predicting one-year returns than the CAPE and while CAPE becomes the better predictor than trailing PE over a five-year period, it is barely better than using a dividend yield indicator.  While I have not included these in the table, I will wager that any multiple (such as EV to EBITDA) would do as good (or as bad, depending on your perspective) a job as market timing.

As a follow-up, I ran a simple test of the payoff to market timing, using the Shiller CAPE and actual stock returns from 1927 to 2016. At the start of every year, I first computed the median value of the Shiller CAPE over the previous fifty years and assumed an over priced threshold at 25% above the median (which you can change). If the actual CAPE was higher than the threshold, I assumed that you put all your money in treasury bills for the following year and that if the CAPE was lower than the threshold, that you invested all your money in equities. (You can alter these values as well). I computed how much $100 invested in the market in 1927 would have been worth in August of 2016, with and without the market timing based on the CAPE:

Download spreadsheet and change parameters
Note that as you trust CAPE more and more (using lower thresholds and adjusting your equity allocation more), you do more and more damage to the end-value of your portfolio. The bottom line is that it is tough to get a payoff from market timing, even when the pricing metric that you are using comes with impeccable credentials. 

3. Investing is relative, not absolute
Notwithstanding its weak spots, let’s take the CAPE as your measure of stock market valuation. Is a CAPE of 27.27 too high, especially when the historic norm is closer to 16? The answer to you may sound obvious, but before you do answer, you have to consider where you would put your money instead. If you choose not to buy stocks, your immediate option is to put your money in bonds and the base rate that drives the bond market is the yield on a riskless (or close to riskless) investment. Using the US treasury bond as a proxy for this riskless rate in the United States, I construct a bond PE ratio using that rate:
Bond PE = 1/ Treasury Bond Rate
Thus, if you invest in a treasury bond on August 22, with a yield of 1.54%, you are effectively paying 64.94 (1/.0154) times your earnings. In the graph below, I graph Shiller’s measures of the CAPE against this T.Bond PE from 1960 to 2016:
Download T Bond Rate PE data
I also compute a ratio of stock PE to T.Bond PE that will use as a measure of relative stock market pricing, with a low value indicating that stocks are cheap (relative to T.Bonds) and a high value suggesting the opposite. As you can see, bringing in the low treasury bond rates of the last decade into the analysis dramatically shifts the story line from stocks being over valued to stocks being under valued. The ratio is as 0.42 right now, well below the historical average over any of the time periods listed, and nowhere near the 1.91 that you saw in 2000, just before the dot com bust or  even the 1.04 just before the 2008 crisis. 

4. Its cash flow, not earnings that drives stocks
The old adage that it is cash flows, not earnings, that drives stocks is clearly being ignored when you look at any variant of PE ratios. To provide a sense of what stock prices look like, relative to cash flows, I computed a multiple of total cash returned to stockholders by companies (including buybacks) and compared these multiples to Shiller’s CAPE in the graph below:
S&P 500 Earnings and Cash Payout
Here again, there seems to be a disconnect. While the CAPE has risen for the market, from 20.52 in 2009 to 27.27 in 2016, as stocks soared during that period, the Price to CF ratio has remained stable over that period (at about 20), reflecting the rise in cash returned by US companies, primarily in buybacks over the period.

Am I making the case that stocks are under valued? If I did, I would be just as guilty as those who use CAPE to make the opposite case. I am not a market timer, by nature, and any single pricing metric, no matter how well reasoned it may be, is too weak to capture the complexity of the market. Absolutism in market timing is a sign of either hubris or ignorance.


The Market’s Kryptonite
At this point, if you think that I am sanguine about stocks, you would be wrong, since the essence of investing in equities is that worry goes with it. If it’s not the high CAPE that is worrying me, what is? Here are my biggest concerns, the kryptonite that could drain the market of its strength and vitality.
  1. The Treasury Alternative (or how much are you afraid of your central bank?)  If the reason that you are in stocks is because the payoff for being in bonds is low, that equation could change if the bond payoff improves. If you are Fed-watcher, convinced that central banks are all-powerful arbiters of interest rates, your nightmares almost always will be related to a meeting of the Federal Open Market Committee (FOMC), and in those nightmares, the Fed will raise rates from 1.50% to 4% on a whim, destroying your entire basis for investing in stocks. As I have noted in these earlier posts, where I have characterized the Fed as the Wizard of Oz and argued that low rates are more a reflection of low inflation and anemic growth than the result of quantitative easing, I believe that any substantial rate rises will have to come from shifts in fundamentals, either an increase in inflation or a surge in real growth. Both of these fundamentals will play out in earnings as well, pushing up earnings growth and making the stock market effect ambiguous. In fact, I can see a scenario where strong economic growth pushes T. bond rates up to 3% or higher and stock markets actually increase as rates go up.
  2. The Earnings Hangover It is true that we saw a long stint of earnings improvement after the 2008 crisis and that the stronger dollar and a weaker global economy are starting to crimp earnings levels and growth. Earnings on the S&P 500 dropped in 2015 by 11.08% and are on a pathway to decline again this year and if the rate of decline accelerates, this could put stocks at risk. That said, you could make the case that the earnings decline has been surprisingly muted, given multiple crises, and that there is no reason to fear a fall off the cliff. No matter what your views, though, this will be more likely to be a slow-motion correction, offering chances for investors to get off the stock market ride, if they so desire.
  3. Cash flow Sustainability: My biggest concern, which I voiced at the start of the year, and continue to worry about is the sustainability of cash flows. Put bluntly, US companies cannot keep returning cash at the rate at which they are today and the table below provides the reason why:

YearEarningsDividendsDividends + BuybacksDividend PayoutCash Payout
200138.8515.7430.0840.52%77.43%
200246.0416.0829.8334.93%64.78%
200354.6917.8831.5832.69%57.74%
200467.6819.40740.6028.67%59.99%
200576.4522.3861.1729.27%80.01%
200687.7225.0573.1628.56%83.40%
200782.5427.7395.3633.60%115.53%
200849.5128.0567.5256.66%136.37%
200956.8622.3137.4339.24%65.82%
201083.7723.1255.5327.60%66.28%
201196.4426.0271.2826.98%73.91%
201296.8230.4475.9031.44%78.39%
2013107.336.2888.1333.81%82.13%
2014113.0139.44101.9834.90%90.24%
2015100.4843.16106.1042.95%105.59%
2016 (LTM)98.6143.88110.6244.50%112.18%
In 2015, companies in the S&P 500 collectively returned 105.59% of their earnings as cash flows. While this would not be surprising in a recession year, where earnings are depressed, it is strikingly high in a good earnings year. Through the first two quarters of 2016, companies have continued the torrid pace of buybacks, with the percent of cash returned rising to 112.18%. The debate about whether these buybacks make sense or not will have to be reserved for another post, but what is not debatable is this. Unless earnings show a dramatic growth (and there is no reason to believe that they will), companies will start revving down (or be forced to) their buyback engines and that will put the market under pressure. (For those of you who track my implied equity risk premium estimates, it was this concern about cash flow sustainability that led me to add the option of allowing cash flow payouts to adjust to sustainable levels in the long term).

So, how do these worries play out in my portfolio? They don’t explicitly but they do implicitly affect my investment choices. I cannot do much about interest rates, other than react, and I will stay ready, especially if inflation pressures push up rates and the fixed income market offers me a better payoff. With earnings and cash flows, there may be concerns at the market level, but I bet on individual companies, not markets. With those companies, I can do my due diligence to make sure that they have the operating cash flows (not just dividends or buybacks) to justify their valuations. If that sounds like a pitch for intrinsic valuation, are you surprised?

The Market Timing Mirage
Will there be a market correction? Of course! When it does happen, don't be surprised to see a wave of “I told you so” coming from the bubblers. A clock that is stuck at 12 o'clock will be right twice every day and I would urge you to judge these market timers, not on their correction calls, which will look prescient, but on their overall record. Many of them, after all, have been suggesting that you stay out of stocks for the last five years or longer and it would have to be a large correction for you to make back what you lost from staying on the sidelines. Some of these pundits will be crowned as great market timers by the financial press and they will acquire followers. I hope that I don’t sound like a Cassandra but this much I know, from studying past history. Most of these great market timers usually get it right once, let that success get to their heads and proceed to let their hubris drive them to more and more extreme predictions in the next cycle. As an investor, my suggestion is that you save your money and your sanity by staying far away from market prognosticators.

YouTube


Datasets
  1. PE ratios from 1960-2016
  2. Shiller CAPE and T.Bond PE (1960-2016)
  3. S&P 500: Earnings, Dividends and Buybacks (2000-2016)
  4. CAPE Market Timing Test

Friday, August 19, 2016

The Bonfire of Venture Capital: The Good, Bad and Ugly Side of Cash Burn!

In my last post on Uber, I noted that it was burning through cash and that this cash burn, by itself, is neither unexpected nor a bad sign. Since I got quite a few comments on what I said, I decided to make this post just about the causes and consequences of cash burn. In the process, I hope to dispel two myths held on opposite ends of the investing spectrum, the notion on the part of value investors, that a high cash burn signals a death spiral for a business and the equally strongly held belief, at the start-up investing end , that a cash burn is a sign of growth and vitality. 

Cash Burn: The what?
Since it is cash burn, not earnings burn, that concerns us, let’s start with the obvious. It is cash flow, not earnings, that is at the heart of a cash burn problem. While many money losing companies have cash burn problems, not all cash burn problems are money losing, and not all money losing companies have a cash burn problem. To understand cash burn, you have to start with a working definition of cash flows and my definition hews closely to what I use in the context of valuing businesses. The free cash flow to the firm is the cash left over after taxes have been paid and reinvestment needs (to maintain existing assets and generate future growth) have been met:

For mature, going concerns, the after-tax operating income and free cash flow to the firm will be positive (at least on average) and that cash flow is used to service debt payments as well as to provide cash flows to equity in the form of dividends and stock buybacks. Any remaining cash flow, after debt payments and dividends/buybacks, augments the cash balance of the company.

But what if the free cash flow to the firm is negative? That can happen either because a company has operating losses or because it has large reinvestment needs or both occur in tandem. If you have negative free cash flow to the firm, you can draw down an existing cash balance to cover that need and if that turns out to be insufficient, you will have to raise fresh capital, either in the form of new debt or new equity. If this negative cash flow is occasional and is interspersed with positive cash flows in other years, as is often the case with cyclical or commodity companies, you consider it to be a reflection of normal operations of the firm and it should cause few issues in valuation. If, on the other hand, a business has negative cash flows year in and year out, it is said to be burning through cash or having a “cash burn” problem.

To measure the magnitude of the cash spending problem, analysts use a variety of measures. One is to compute the dollar cash spent in a time period, usually a month, and that is termed the Cash Burn rate. Another is to compute the Cash Runway, the time period that it will take for a company to run through its existing cash balance. Thus, a firm with a $1 billion cash balance and a negative cash flow of -$500 million a year has a 2-year Cash Runway. In contrast, another company with a $1 billion cash balance and a negative cash flow of -$ 2 billion a year has only a 6-month Cash Runway. 

Cash Burn: The Why?
Looking at the definition of cash flows should give you a quick sense of why you get high cash burn values (and ratios) at some companies. If your company is and has been losing money or generating very small earnings for an extended period and it sees high growth potential in the future (and invests accordingly), your cash flows will reflect that reality. 

That combination of low operating income/operating losses and high reinvestment is what you should expect to see at many young companies and the resulting negative free cash flow to the firm will be the norm rather than the aberration. As the companies move through the life cycle, the benign perspective on cash burn is that this will cease to be a problem.

As the company scales up, its operating income and margins should increase and as growth starts to scale down (in future years), the reinvestment should start dropping. 

Cash Burn: The what next?
The combination of higher operating margins and lower reinvestment should generate a cross over point where cash flows turn positive and these positive cash flow will carry the value. Rather than talking in abstractions, let me use the numbers in my August 2016 Uber valuation to illustrate. The story that I am telling in these numbers is of a going concern and success, with high revenue growth accompanied by improving operating margins as the first leg, followed by declining growth (and reinvestment) converting negative cash flows to positive cash flows in the second leg and a steady state of high earnings and cash flows reflected in a going concern value in the final phase.
In my Uber forecasts, the cash flows are negative for the first six years, with losses in the first five years adding on to reinvestment in those years. The cash flows turn positive in year 7, just as growth starts to slow and accelerate in the final years of the forecasts.  Though these numbers are specific to Uber, the pattern of cash flows that you see in this figure is typical of the good cash burn story.

The life cycle story that I have laid out is the benign one, where after its start-up pains, a young company turns the corner, starts generating profits and ultimately turns cash flows around. Before you buy into the fairy talk that I have told you, you should consider a more malignant version of this story. In this one, the firm starts off as a growth firm with negative margins and high reinvestment (and cash burn). As the revenues increase over time and the company scales up, the cost structure continues to spiral out-of-control and the margins become more negative over time, rather than less. In fact, with reinvestment creating an additional drain on the cash flows, your free cash flow will be negative for extended and very long time periods and you are on the pathway to venture capital hell. To illustrate what the cash flows would look like in this malignant version of cash burn, I revisited the Uber valuation and changed two numbers. I reduced the operating margin (targeted for year 10) from 20% down to 5% (making ride sharing a commoditized business) and increased reinvestment to match a typical US company (by setting the sales to capital ratio to two, instead of three). The effects on the cash flows are dramatic.
The cash flows stay negative over the next ten years. In this scenario, it is very unlikely that Uber will make it to year 10 or even year 5, as capital providers will balk at feeding the cash burn machine?

So, when is cash burn likely to be value destructive or fatal? If the company operates in a market place, where competition keeps pushing product prices down and the costs of delivering these products continue to rise, it is already on a course to report bigger and bigger losses, even before considering reinvestment. If this company reinvests for growth and the product market conditions do not change (i.e., price cutting and rising costs are expected to continue), it is likely that the reinvestment will not deliver the earnings required to justify that investment. Here, there is no light at the end of the tunnel, as negative cash flows will generally become more negative over time and even when they do turn positive, will be insufficient to cover the burden of negative cash flows in earlier time periods.

Cash Burn: So what?
Though stories about young companies and their cash burn problems abound, there are few that try to make the connection between cash burn and value other than to point to it as a survival risk. To make the connection more explicit, it is worth thinking about why and how cash burn affects the value of an enterprise. 
  1. Dilution Effect: A company has to raise cash to burn through it and if that cash is raised from fresh equity, as it inevitably has to be for young growth companies, the existing owners of the business will have to give up some of their ownership of the company. If you are an equity investor, the greater the cash burn in a company, the less of the company you will end up owning, even if it survives and prospers.
  2. Growth Effect: The dilution effect presumes that there are capital providers who will be supply the cash needed to keep the firm going through its cash burn days, but what if that presumption is incorrect? The best case scenario for the firm, when capital dries up, is that it is able to rein in discretionary spending (which will include all reinvestment for growth) until capital becomes available again. In the meantime, though, the company will have to scale back its growth plans.
  3. Distress Effect: The more dangerous consequence of capital drying up for a young firm with negative free cash flows Is that the firm’s survival is put at risk. This will be the case if the company is unable to meet its operating cash flow needs, even after cutting discretionary capital spending to zero. In this scenario, the firm will have to liquidate itself and given its standing, it will have to settle for a fraction of its value as a going concern.
In intrinsic valuation, both of these effects can and should be captured in your intrinsic value. 
  1. The dilution effect manifests itself as negative cash flows in the early years and a drop in the present value of cash flows. For instance, in my Uber valuation, the present value of the expected cash flows for the first seven years, all negative, is $4.4 billion. While the positive cash flows thereafter more than compensate for this, I am in effect reducing the value of Uber by about 20% for these negative cash flows and this reduction can be viewed as a preemptive discounting of my equity stake in the company for future dilution.
  2. When I discount the negative cash flows back to today and assume that Uber has no chance of game-ending failure, I am assuming that Uber has and will continue to have access to capital, partly because of its size and partly because existing investors have too much to lose if the company goes into death throes. If you believe these assumptions to be too optimistic, you can adjust the valuation in two ways. The first is by putting a cap on how much new capital the firm can raise each year, which will also operate as a constraint on future growth. The other is by allowing for a probability that the firm will fail, either because capital markets shut down or cash flows are more negative than expected. In my Lyft valuation in September 2015, for instance, I allowed for a 10% probability of this occurring and assumed that equity investors would get close to nothing if it did, effectively reducing my valuation today.
In pricing, how does it show up? In a young company, pricing usually involves forecasting revenues or earnings in a future time period, applying a multiple, at which you believe the company will be priced by a potential buyer or the market in an IPO, to these revenues and pricing and then discounting back that end price to today using a target rate of return.

As you can see, there is no explicit adjustment for cash burn in this equation. While you could bring in the effect of negative cash flows, just as you did in intrinsic valuation, by discounting them back to today and netting out against the pricing, doing that removes one of the biggest reasons why investors and analysts like pricing, which is that it is simple. The only adjustment mechanism left is the target rate of return and, in my view, it becomes the mechanism that venture capitalists and investors use to deal with cash burn concerns. Given that these target rates of return also carry the weight of reflecting failure risk, it should come as no surprise that VC target rates of return for investment look high (at 30%, 40% or even 50%) relative to rates used for established companies.

An Investor Checklist for Cash Burn
If you are an investor in a company, public or private, that is burning through cash, you may be wondering at this point what you would look at to determine whether a company’s cash burn is benign or malignant and whether it is on a glide path to glory or a Hari Kari mission. Here are some things to consider:
  1. Understand why the company is burning through cash: Looking back at the constituents of free cash flows, there are multiple paths that can lead to negative free cash flows. The most benign scenario is one where a money making company reports negative cash flows because of large reinvestment. Not only is this negative cash flow a down payment for future growth but it is also discretionary, insofar as managers can scale back reinvestment if capital becomes scarce. The most dangerous combination is a money losing company that reinvests very little, since there is little potential for a growth payoff and management will be helpless if capital freezes up.
  2. Diagnose the operating business: While there is often a lot of noise around the numbers, you still have to make your best judgments about the profitability of the underlying business. In particular, you want to focus on the pricing power that your company has and the economies of scale in its cost structure. The most benign scenario on this dimension is one where the company has significant pricing power and a cost structure that benefits from scale, allowing for margin improvement over time.
  3. Gauge management skills: Managing a cash-burning company does require management to keep costs under control, while reinvesting to generate growth and to take care of short term cash flow problems, while mapping out a long term strategy. The best case scenario for investors is that the company is run by a management team that works within the cash flow constraints of today while mapping out pathways to profitability over time. The worst case scenario is that the company is managed by those who view negative cash flows as a badge of honor and a sign of growth rather than a temporary problem to overcome.
  4. Growth/Reinvestment trade off: Since reinvesting for future growth can be a big reason for negative cash flows, to assess the payoff in value terms, you have to both estimate how much growth will be created and its value effect. In its most value-creating form, reinvestment will generate high growth coupled with high returns and its most value-destructive form, reinvestment will drain cash flows while generating low growth and poor profits.
  5. Capital Market A firm with a cash burn problem is more depending upon capital markets for its survival, since a closing of these markets may be sufficient to put the firm into receivership. It is no surprise, therefore, that cash burning companies that have larger cash balances or more established capital providers are viewed more positively than cash burning companies that have less cash and have less access to capital.
This checklist requires subjective judgments along the way and you will be wrong sometimes, in spite of your best efforts. That should not stop you from trying.

The Bottom Line
If you are an investor in a company that is burning through cash, don't panic! If your investments are in young companies, it is exactly what you should expect to see though you should do your due diligence, examining the reasons for the cash burn in and the soundness of the underlying business model. If you are an old-time value investor, weaned on large dividends, positive cash flows and margin of safety, you may find yourself avoiding companies that have these cash burn problems but be glad that there are investors who are less risk averse than you are and willing to bet on these companies.

YouTube video


Posts on valuing young companies

  1. Blood in the Shark Tank: Pre-money, Post-money and Play-money Valuations
  2. Billion Dollar Tech Babies: A Blessing of Unicorns or a Parcel of Hogs
  3. The Bonfire of Venture Capital: The Good, Bad and Ugly Side of Cash Burn

Wednesday, August 17, 2016

The Ride Sharing Business: Is a Bar Mitzvah moment approaching?


I did a series of three posts on the ride sharing business about a year ago, starting with a valuation of Uber, moving on to an assessment of Lyft, continuing with a global comparison of ride sharing companies and ending with a discussion of the future of the ride sharing business. In the last of those four posts, I looked at the ride sharing business model, argued that it was unsustainable as currently structured and laid our four possible ways in which it could be evolve: a winner-take-all, a losing game, collusion and a new player (from outside). While ride sharing continues its inexorable advance into new markets and new customers, the last few months has also brought a flurry of game-changing actions, culminating with Uber’s decision about a week ago to abandon China to arch-rival Didi Chuxing. It is a good time to take a look at the market again and perhaps map out where it stands now and what the future holds for it.

The Face of Disruption
While there is much to debate about the future of the ride sharing business, there are a few facts that are no longer debatable. 
  1. Ride sharing continues on its growth path: Ride sharing has grown faster, gone to more places and is used by more people than most people thought it would be able to, even a couple of years ago. The pace of growth is also picking up. Uber took six years before it reached a billion rides in December of 2015, but it took only six months for the company to get to two billion rides. For just the US, the number of users of ride sharing services is estimated to have increased from 8.2 million in 2014 to 20.4 million in 2020. 
    YearNumber of US ride sharers (in millions)% of US adult population
    2014
    8.20
    3.40%
    2015
    12.40
    5.00%
    2016
    15.00
    6.00%
    2017
    17.00
    6.70%
    2018
    18.20
    7.10%
    2019
    19.40
    7.50%
    2020
    20.40
    7.80%
  2. It is globalizing fast: In the same vein, ride sharing which started as a San Francisco experiment that grew into a US business has become global in just a short period, with Asia emerging as the epicenter for future growth. Didi Chuang, the Chinese ridesharing company, completed 1.43 billion rides just in 2015 and it now claims to have 250 million users in 360 Chinese cities. Ride sharing is also acquiring deep roots in both India and Malaysia, and is making advances in Europe and Latin America, despite regulatory pushback. 
  3. Expanding choices: The choices in ride sharing are becoming wider, to attract an even larger audience, from carpooling and private bus services to attract mass transit customers to luxury options for more upscale customers. In addition, ride sharing companies are experimenting with pre-scheduled rides and multiple stops on single trip gain to meet customer needs. 
  4. Devastating the status quo: All of this growth has been devastating for the status quo. Even hardliners in the taxicab and old time car service businesses recognize that ride sharing is not going away and that the ways of doing business have to change. The price of a New York city medallion which was in excess of $1.5 million before the advent of ride sharing continues its plunge, dropping to less than $500,000 in March 2016. The price of a Chicago cab medallion, which peaked at $357,000 in 2013, had dropped to $60,000 by July 2016.
In short, there is no question that the car service business as we know it has been disrupted and that there is no going back to the old days. If you own a taxi cab or a car service business, the question is no longer whether you will lose business to ride sharing companies but how quickly, even with the regulatory authorities standing in as your defenders.

A Flawed Business Model
Disruption is easy but making money off disruption is difficult, and ride sharing companies would be exhibit 1 to back up the proposition. While the ride sharing option is here to stay and will continue to grow, ride sharing companies still have not figured out a way to convert ride sharing revenues in profits. In making this statement, though, I am relying on dribs and drabs of information that are coming out of the existing ride sharing companies, almost all of whom are private. Piecing together the information that we are getting from these unofficial and often selective leaked information, here is what seems clear:
  1. Raising capital at a hefty pace: In the last two years, the ride sharing companies have been active in raising capital, with Uber leading the way and Didi Chuxing close behding. In the graph below, I list the capital raised collectively by players in the ride sharing business over the last three years and the pricing attached to each company in its most recent capital round.
  2. Ride Sharing Company
    Amount Raised in last 12 months (in millions)
    Investor
    Company Priced at (in millions)
    Didi
    $7,300.00
    Apple, Alibaba, Softbank & Others
    $28,000
    Uber
    $3,500.00
    Saudi Arabian Sovereign Fund
    $62,500
    Lyft
    $500.00
    GM
    $5,500
    Ola
    $500.00
    Didi & Existing Investors
    $5,000
    Grabtaxi
    $350.00
    Didi & CIC
    $1,800
    Gett
    $300.00
    Volkswagen
    $2,000
    Via
    $100.00
    VC
    NA
    Scoop
    $5.10
    BMW
    NA
  3. At rich prices: As the table above indicates, the investors who are putting money in the ride sharing companies are willing to pay hefty prices for their holdings, with no signs of a significant pullback (yet). Uber, at its current pricing, is being priced higher than Ford or GM. Note that I use the word “pricing” to indicate what investors are attaching as numbers to these companies because I don’t believe that they have the interest or the stomach to actually value them. If you are confused about the contrast between “value” and “price”, please see my blog post on the topic.
  4. From unconventional capital providers: The capital coming into ride sharing companies is  coming less from the traditional providers to private businesses and more from public investors (Mutual funds, pension funds, wealth management arms of investment banks and sovereign funds). The reasons for the shift are simple on both sides. Public investors want to be invested in the ride sharing companies because they have visions of public offerings at much higher prices and are afraid to be left on the side lines, if that happens. The ride sharing companies are for it because some of them (Uber and Didi, in particular) are getting too big for venture capitalists to capitalize and perhaps because public investors are imposing less onerous constraints on them for providing capital.
  5. While burning through cash quickly: As quickly as the capital is being raised at ride sharing companies, it is being spent at astonishing rates. Uber admitted that it burned through more than a billion dollars in cash in 2015, with a significant portion of that coming from its attempts to increase market share in China. Its competitors are matching it, with Lyft estimated to be burning through about $50 million in cash each month ($600 million over a year) and Didi Chuxing's CEO, Jean Liu, openly admitting that “We wouldn’t be here today if it wasn’t for burning cash”. 
The cash burn at ride sharing companies, by itself, is neither uncommon nor, by itself, troubling After all, to grow, you have to spend money, and a young start up often loses money because of infrastructure investments and fixed costs, and as revenues climb, margins should improve and reinvestment should scale down (at least on a proportional basis). The problem with ride sharing is companies in this business are losing money only partially because of their high growth. In fact, I believe that a significant portion of their expenses are associating with maintaining revenues rather than growing them (ride sharing discounts, driver deals and customer deals). I am afraid that I cannot back up that statement with anything more tangible than news stories about ride sharing wars for drivers, big discounts for customers and the leaked statistics from the ride sharing companies.  In effect, it looks like the business model that has brought these companies as far as they have in such a short time period are flawed, because what allowed these companies to grow incredibly fast is getting in the way of converting revenues to profits, since there are no moats to defend.

If you are skeptical about my contention, here is a simple test of whether the cash burn is just a consequence of going for high growth or symptomatic of a business model problem. Assume that the growth ends in the ride sharing business tomorrow and that the ride sharing companies were to compete for existing riders. Do you think that the pieces are in place for these companies to generate profits? I don't think so, as ride prices keep dropping, new ride sharing businesses pop up and the costs continue to increase. 

The Bar Mitzvah Moment
In a post in November 2014 on Twitter’s struggles, I argued that every young growth company has a bar mitzvah moment, a time in its history when markets shift their attention away from surface measures of growth (number of users, in the case of Twitter) to more operating substance (evidence that the users are being monetized). I also argued that to get through these bar mitzvah moments successfully, young growth companies have to be managed on two levels, delivering the conventional metrics on one level while working on creating a business model to convert these metrics into more conventional measures of business success (revenues and earnings) on the other.

This may be premature but I have sense that the bar mitzvah moment has arrived or will be arriving soon for ride sharing companies. After an initial life, where investors have been easily sated with reports of more ridesharing usage (number of cities served, rides, drivers etc.), these investors are starting to ask the tough questions about how ride sharing companies propose turning these impressive usage statistics into profits. What’s driving investor uneasiness?

  • The first factor is that the public investors who have put their money into the ride sharing companies operate under shorter time horizons than many VC investors and the fact that an IPO is not imminent in any of these companies adds to their impatience to see tangible results. 
  • The second factor is that the belief that there will be a winner-take-all, who can then proceed to charge what the market will bear, has receded, as all of the players in the market continue to attract capital. 
  • The third factor is that the possibility that big players like Apple and Google will enter the market is becoming a plausibility and perhaps even a probability and their technological edge and deep pockets could put existing ride sharing companies at a disadvantage.
In my view, it is this perception that change is coming that is leading the flurry of activity that we have seen at ride sharing companies in the last few months. In conventional business terms, the ride sharing companies are trying to shore up their business models, generate pathways to profitability and build competitive advantages. Broadly speaking, these efforts include the following:
  1. Increased Switching costs: The ride sharing companies are working on ways to increase the costs of switching to their competitors, both among drivers (who I described in a prior post as uncontracted free agents) and customers. Uber’s partnership with Toyota, where Toyota will lease cars on favorable terms to Uber drivers, will benefit drivers but will also bind them more closely to Uber, and make it more difficult for them to threaten to go to Lyft for a few thousand dollars. GM’s agreement with Lyft is not as specific but seems to be directed at the same objective. 
  2. Cooperation/Collusion: In my ride sharing post in October 2015, I raised the possibility that the ride sharing companies would follow the route of the Mafia in the United States in the middle of the last century, where crime families divided the US into fiefdoms and agreed not to invade each other’s turf. Uber’s decision to abandon the Chinese market to Didi in return for a 20% ownership stake in that company, in particular, seems to be designed to accomplish this no-compete objective. Uber’s China move specifically seems to be designed to stop the mutually assured destruction that a free-for-all fight with Didi will create. 
  3. Higher Capital Intensity: Though there is little that is tangible that I can point to in support of this notion, I think that the ride sharing companies now recognize that their absence of tangible assets and infrastructure investment can now operate as an impediment to building a sustainable business. Consequently, I will not be surprised to see more investment by the ride sharing companies in self-driving cars, robots and other infrastructure as part of the phase of building up business moats.
As we witness the breakneck pace of change in the ride sharing business, the big question if you are considering investing in these companies is whether these actions will work in laying the groundwork for profitability. Well, yes and no. If the ride sharing business were frozen to include only the current players, it is probable that they will come to an uneasy agreement that will allow them to generate profits. The problem, though, is that the existing structure of this business is anything but settled, with new ride sharing options popping up and large technology companies rumored to be on the cusp of jumping in. The unquestioned winners in the ride sharing game are car service customers, who have seen their car service costs go down while getting more care service options. . 

Uber: An updated valuation
In September 2015, I valued Uber at $23.4 billion, based upon my reading of the market then. In assessing this value, I incorporated what I saw as Uber’s strengths (its reach globally and across many different businesses) and its weaknesses (an out-of-control cost structure and the elimination of many of the insurance and regulatory loopholes that allowed ride sharing to gain such an advantage over conventional car service).  In the last year, as I see it, here is how the fundamental story has been impacted by developments in the last year: 

  1. Revenues: Uber’s growth continues, measured in cities and rides, though the rate of growth has started to slow down, not surprising given its size. Its decision to leave China, the largest ride sharing market in the world, even if it was the right one from the perspective of saving itself from a cash war, will reduce its potential revenues in the future.
  2. Competition: Before you over react to Uber's exit from China, there is good news in that decision. First,by removing the costs associated with going after the China market from the equation, it reduces the problem of cash burn, at least for the near future. Second, its peace treaty with Didi Chuxing puts the smaller players at risk. Lyft, Ola and Grabtaxi, all companies that Didi invested in to stop the Uber juggernaut, may now be left exposed to competition. Third, in return for its decision to leave the China market, Uber does get a 20% stake in Didi Chuxing.
  3. Costs: On the cost front, the ride sharing business continued to evolve, with most of the changes signaling higher costs for the ride sharing companies in the future. Seattle's decision to let Uber/Lyft drivers unionize may be the precursor of similar developments in other cities and higher costs for both companies. On the legal front, cities continue to throw up roadblocks for the ride sharing companies. Uber and Lyft abandoned Austin, after the city passed an ordinance requiring drivers for both services to pass background checks. One symptom of these higher costs is in the leaked financials from Uber, which suggested that the company lost more than a billion dollars in the first half of 2015. 
  4.  Imminent competition: The Silicon Valley gossip continues about Apple and Google preparing to enter the ride sharing market, with Google announcing that it has entered into a partnership with Fiat and that a top robocist had left the self-driving car unit a few days ago. Never one to hide in the shadows, Elon Musk added car sharing to his long list of to dos at Tesla in his Master Plan for the company. It seems clear that while the timing of the change remains up in the air, change is coming to this business.
None of the changes are dramatic but tweaking my valuation to reflect those changes, as well as changes in the macro environment in the last year, my updated valuation for Uber is $28 billion, a little higher than my estimate last year of $23.4 billion. The loss of the China market reduces the total market size but it is offset by a higher market share of the remaining market and a 20% stake in Didi Chuxing. The pricing attached to this Didi stake is $7 billion, but since the same forces that have elevated Uber's pricing are at play across the ride sharing market, I have attached a value of $5 billion to the stake. The picture of the valuation is below:
Download spreadsheet
Clearly, the Saudi Sovereign fund, Goldman Sachs and Fidelity would disagree with me, since their estimated pricing for Uber is more than double my value. They could very well be right in their judgment and I could be wrong, but my valuation reflects my story about the company, which is perhaps not as expansive nor as optimistic as the stories that they might be telling.

What's next?
The ride sharing business is in a state of flux and the next few months will bring more experimentation on the part of companies. Some of these experiments will be with the services offered but more of them will be attempts to get business models that work at converting riders to profits. The ride sharing companies have clearly won the first phase of the disruption battle with the taxicab and car service companies and have been rewarded with high pricing and plentiful capital. The next phase will separate the winners from the losers song the ride sharing companies and it is definitely not going to be boring.

Update:  To the many people who have commented about this valuation, I thank you, even if you vehemently disagree with me. To give you some sense of what the feedback has been across my blog, email and twitter, more of you seem to think that I am being too optimistic than pessimistic about Uber's future. Whatever your point of view, I don't claim to have a monopoly on the right story for each company that I value in this blog and the resulting valuation. However, rather than take issue with what you think is wrong with my story/valuation, I would suggest that you download the spreadsheet that is attached and make it your story/valuation. Thus, if you believe that my total market size is too low and/or that my judgment on profit margins too pessimistic, replace them with your own and you will have your own valuation of Uber. 

YouTube Video


Last year's posts on ride sharing
  1. On the Uber Rollercoaster: Narrative Tweaks, Twists and Turns
  2. Dream Big or Stay Focused? The Lyft Answer!
  3. The Future of Ride Sharing: Playing Pundit

Uber Valuations
  1. June 2014
  2. September 2015
  3. August 2016